Slide through forty years of change
Landsat images from 1985 and 2025 show new lakes and irrigated fields in Egypt's Toshka Depression.
Captured July 2026
The Landsat record
Google Earth Engine can compare one place across Landsat missions. The landsat-all dataset handles the satellite handoffs, so the same request can render an early scene beside a recent one.
The prompt
Using Google Earth Engine, show me how Toshka, Egypt, changed between 1985 and today. Make it a before-and-after slider and tell me what changed.
The response
Using Google Earth Engine, show me how Toshka, Egypt, changed between 1985 and today. Make it a before-and-after slider and tell me what changed.
I rendered Toshka from the long Landsat record, comparing 1985 with the latest saved view from 2025.
 Executing
 google_earth_engine.render_image 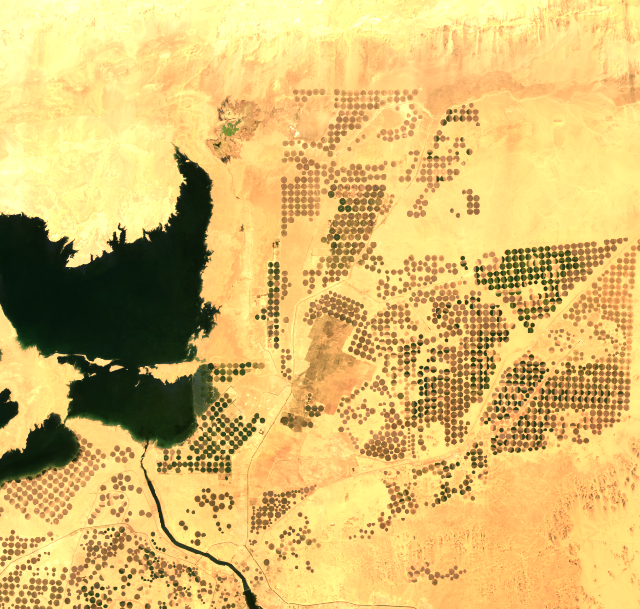
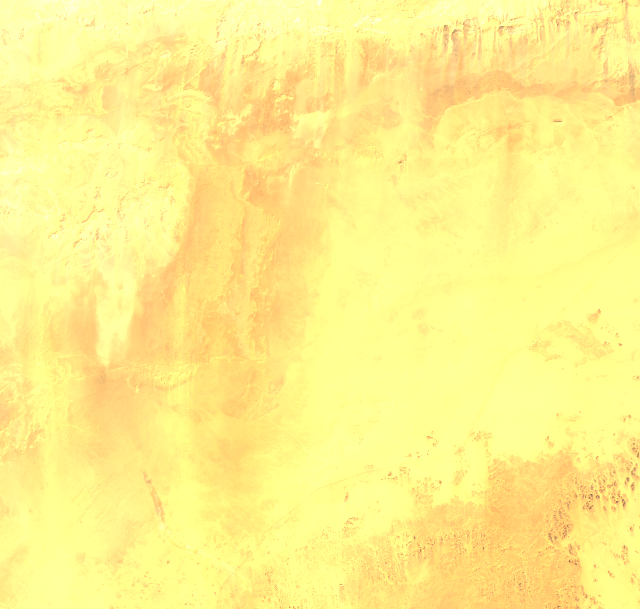
The change is dramatic. In 1985, this was uninterrupted desert. By 2025, the comparison shows lakes in the Toshka Depression and large circular irrigated fields around them.
The water has its own history. Egypt diverted Lake Nasser overflow into the depression during a 1998 flood year. The lakes peaked around 2001, nearly disappeared through the 2000s, then refilled after 2019 as the reservoir rose again. The irrigated fields are newer still.
This is the useful split between a before-and-after image and the answer around it: the render establishes that the landscape changed; the record explains that it was not one steady transformation.
The two dates
“Today” does not mean a live image. This saved run uses a 2025 Landsat scene on the recent side, and the toolkit should name the dates and sensors it used. The two halves also come from different instruments. The image shows what changed, not why; rainfall, water, or land-cover data would be needed for that.