
| Geo | EO | Earth Engine | |
|---|---|---|---|
| Answers | Where is it? | How is it now? | How was it before? |
| Source | OpenStreetMap | Copernicus | Earth Engine |
| History | Today only | 2015 onward | 1950 onward |
| Resolution | Vector | 10 m | 10 m to 11 km |
| Draws | Outline maps | Imagery | Imagery, terrain |
| Measures | Distance, area | Indices, change | Rain, heat, people |
compare, overlays and aoi_ref mean the same thing in all three | |||
The bottom row of the table matters most. compare makes a before and after in all three. overlays draws a boundary in all three. aoi_ref is a shared region handle, so a boundary made in Geo renders in the others without the geometry ever passing through the conversation. Use the wipe slider in EO and you already know it in Earth Engine.
Forty years in one call
Sentinel-2, which EO uses, has been flying since 2015. Landsat has been up since 1972, with a usable archive from 1982. Most changes people ask about took longer than ten years to happen, and now they are in reach.
No single satellite covers forty years. Landsat 5 lasted until 2011, Landsat 7 broke in 2003, Landsat 8 arrived in 2013. The toolkit hides the roster behind one alias, landsat-all, which spans the whole record and picks the right instrument for each date. One call, two dates, forty years apart.
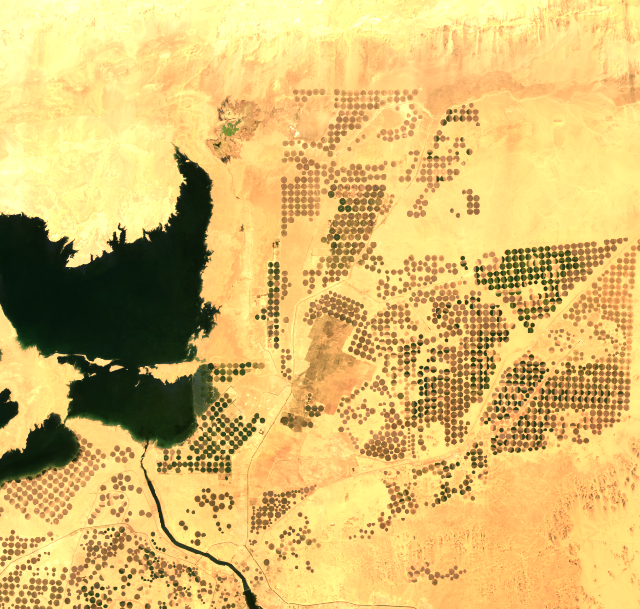
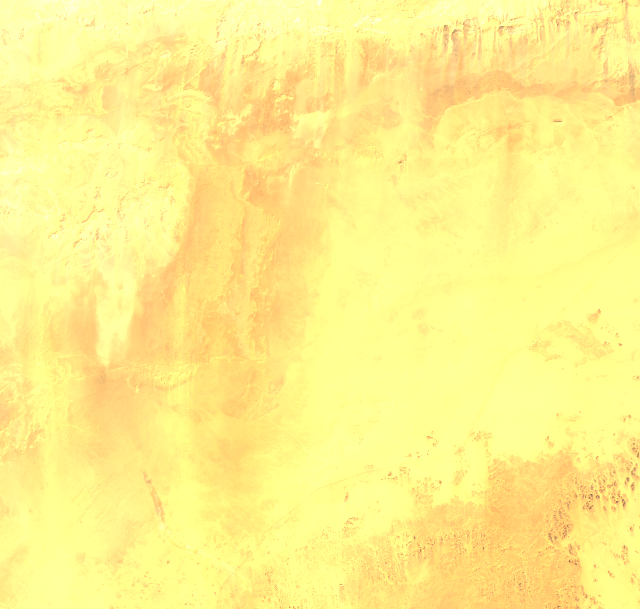
(Toshka, in Egypt's Western Desert. 1985 left of the handle, 2025 right. Landsat 4/5 and Landsat 8/9, USGS.)
In 1985 there is nothing there. The lakes did not exist until 1998, when Egypt diverted Lake Nasser's overflow into the Toshka Depression during a flood year. They peaked around 2001, evaporated through the 2000s to almost nothing, and refilled after 2019 when the reservoir rose again. The circular fields are newer still.
One practical note. This toolkit needs no account. No Google sign-in, no cloud project, no Earth Engine registration. Connect it in the portal and it works. The other Earth Engine MCP servers I have seen require you to self-host and bring your own Google project.
The questions imagery cannot answer
Pictures tell you what the ground looks like. Earth Engine also carries data that is not a picture: rainfall since 1981, temperature since 1950, population counts, land cover classified by a model. Different questions, and the good ones come from combining two.
Here is northern Kenya, a 300 km box of arid rangeland, in two different years.
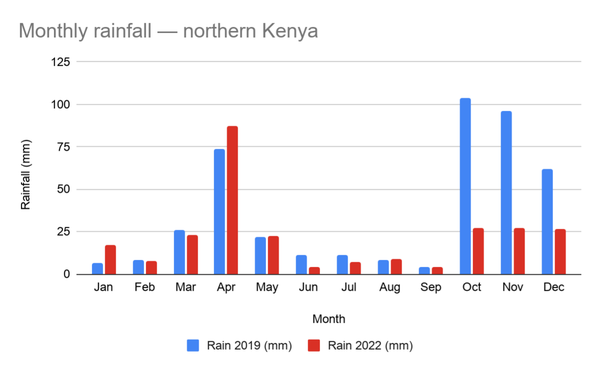
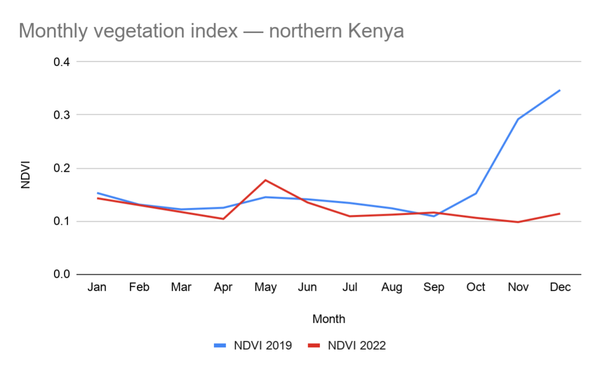
The rainfall estimate is a satellite product at 5.5 km resolution. The vegetation index is a different satellite at 10 m. Neither knows the other exists. Put the charts together and vegetation follows rainfall by about a month, in both years.
Now look at the end of each year. In 2019 the short rains delivered 104 mm in October, 96 in November, 62 in December, and the vegetation index tripled, 0.11 to 0.35. In 2022 the same months delivered 27 mm each and the index did nothing. It ended December lower than it started October. That flat line is the Horn of Africa drought, the fifth failed rainy season in a row.
One thing in the numbers surprised me. April 2022 got 87 mm in a single month and produced the year's only green pulse. October through December 2022 got 81 mm between them, nearly the same water, and produced nothing. In arid country the question is not how much rain falls but how hard. Light rain on hot ground evaporates before roots reach it.
I did not ask either dataset that question. It fell out of putting the two series side by side.
Saying what it could not do
The vegetation series above arrived with a warning. Earth Engine gives each request sixty seconds; one of my calls ran out after eleven of twelve months, and the response said so: eleven processed, one missing. So I fetched the missing month with a second call, and that month, December, turned out to be the peak of the entire series. A quieter API would have handed me eleven rows, the chart above would be missing its highest point, and I would not know.
The rest of the toolkit behaves the same way. Renders name the satellite era they came from. Landsat 7's scan line corrector failed in May 2003 and every scene since has diagonal gaps, so the toolkit avoids that satellite where it can. There is an eighteen month stretch, after Landsat 5 retired and before Landsat 8 arrived, where the broken satellite was the only one flying, and a render from that window tells you so. Land cover fractions report the resolution they were computed at, which for a whole country is about a kilometre and a half, coarse enough that small towns dissolve into the fields around them.
Temperature gave me the sharpest version. I asked for Egypt's average in 1955 and again in 2025: 21.90 °C and 22.97 °C. A degree of warming in seventy years, ready for a headline. Except February 2025 came out 2.2 °C cooler than February 1955, and August 2.7 °C warmer. Two single years measure weather, not climate. The toolkit answered exactly the question I asked. The question was the problem.
The border you draw is a claim
Ask for Egypt and the toolkit clips the image at Egypt's border. To do that it has to know where the border is, and it uses the US State Department's LSIB dataset, public domain and published in Earth Engine's catalogue.
So when you draw Egypt you are publishing the United States government's opinion of where Egypt ends. For Egypt that is not hypothetical. Halayib on the Red Sea coast and Bir Tawil south of it are disputed with Sudan, and LSIB picks a side. Kashmir, Crimea and Western Sahara raise the same problem.
There is no neutral file. OpenStreetMap encodes who controls the ground. Natural Earth makes its own editorial calls. Every boundary dataset is an opinion drawn as a polygon, and a tool that draws borders is choosing one. The toolkit names its source in every response, which is as much as a tool can do: not pretend the choice was never made.
Lights
One more dataset, for a different question again. Not plants, people.
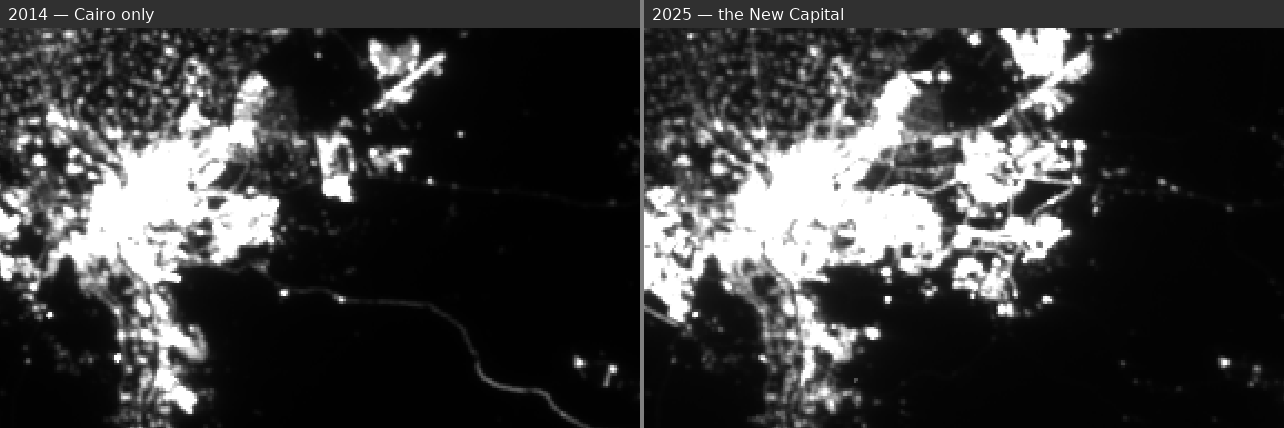
The bright ribbon is the Nile, same as it ever was. The patch to the east is Egypt's New Administrative Capital, built on empty desert since 2016. Night lights track human activity, and a new city is about the easiest thing they catch.
The other two
Geo and EO got updates this week too.
Geo can draw now. render_outline produces hosted maps from OpenStreetMap geometry, with outlines, markers, labels and spotlights, so the toolkit went from answering questions about places to showing them. It also gained aoi_ref, the region handle from the top of this post, which exists because a state boundary with 139,000 vertices once had to travel between two toolkits and could not. Now it never has to.
EO gained five indices, burn severity and moisture among them, and a per-pixel change tool called temporal_map that answers not just what changed but when every pixel changed. That one gets its own post.
Say where, say when, and drag the handle.
As always, ideas and suggestions are welcome at gerrit@toolforest.io.